
About MMT
MMT
Metrics Monitoring Tool is part of Pekka Mäkiaho's PhD work. MMT is in use at Tampere University's courses: Project work and Software Project management.
It is used for logging working hours in a project, for managing a project and reporting its state, and for observing one project or the whole portfolio visually.
With MMT you can observe data at portfolio level, at project level or even see the statistics of an individual project member.
See also publications related to MMT.
Statistic page
On the Statistic-page you can first see the project manager's opinion on the state of the project at each week indicated with traffic lights. You can see also if the weekly report is missing or if was delivered late (L).
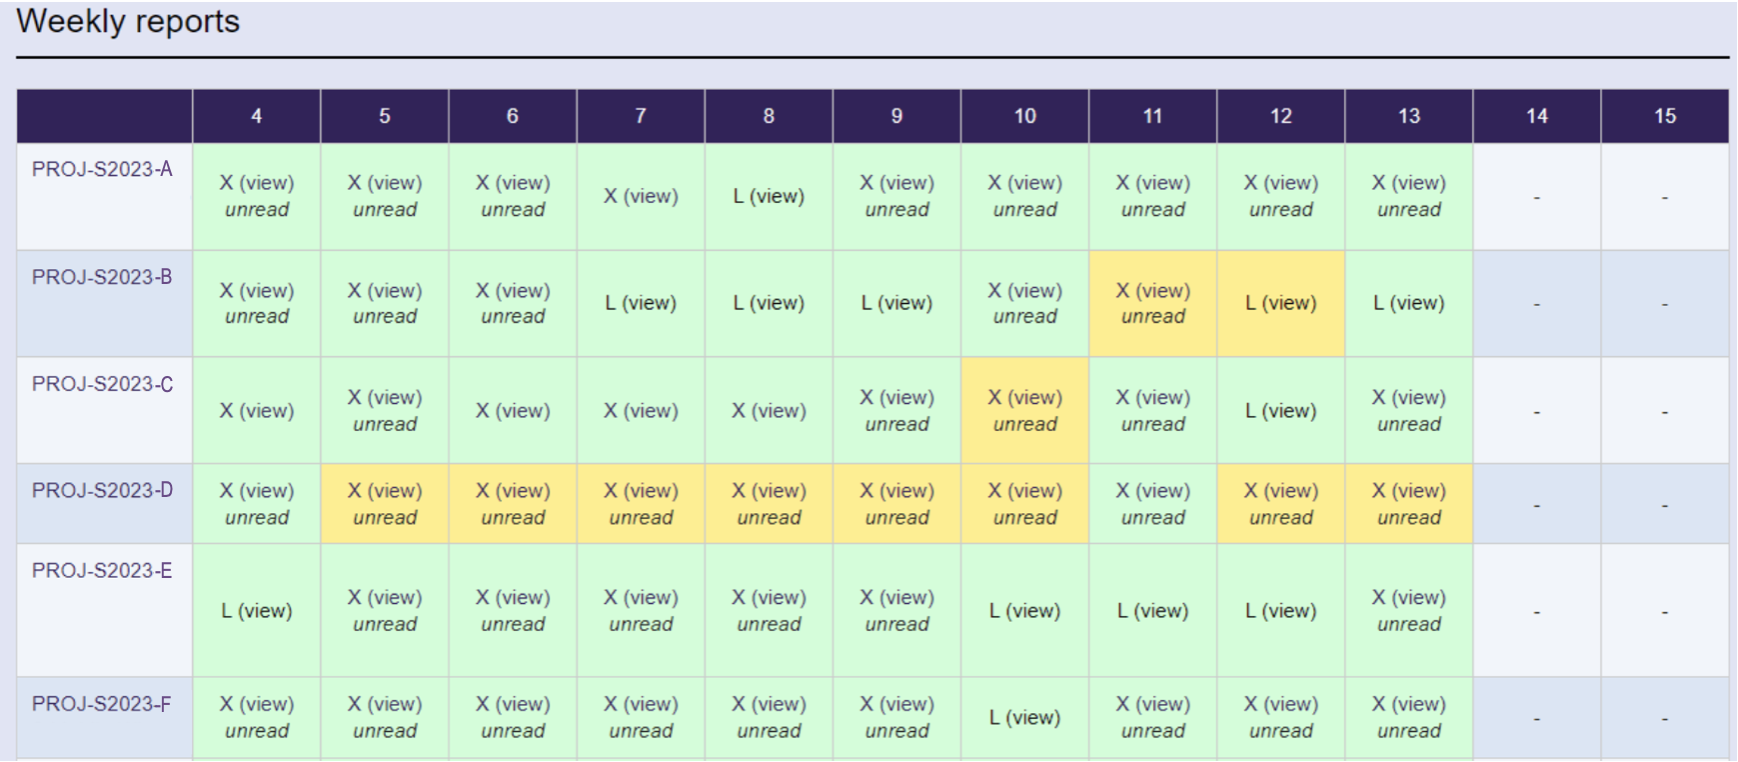
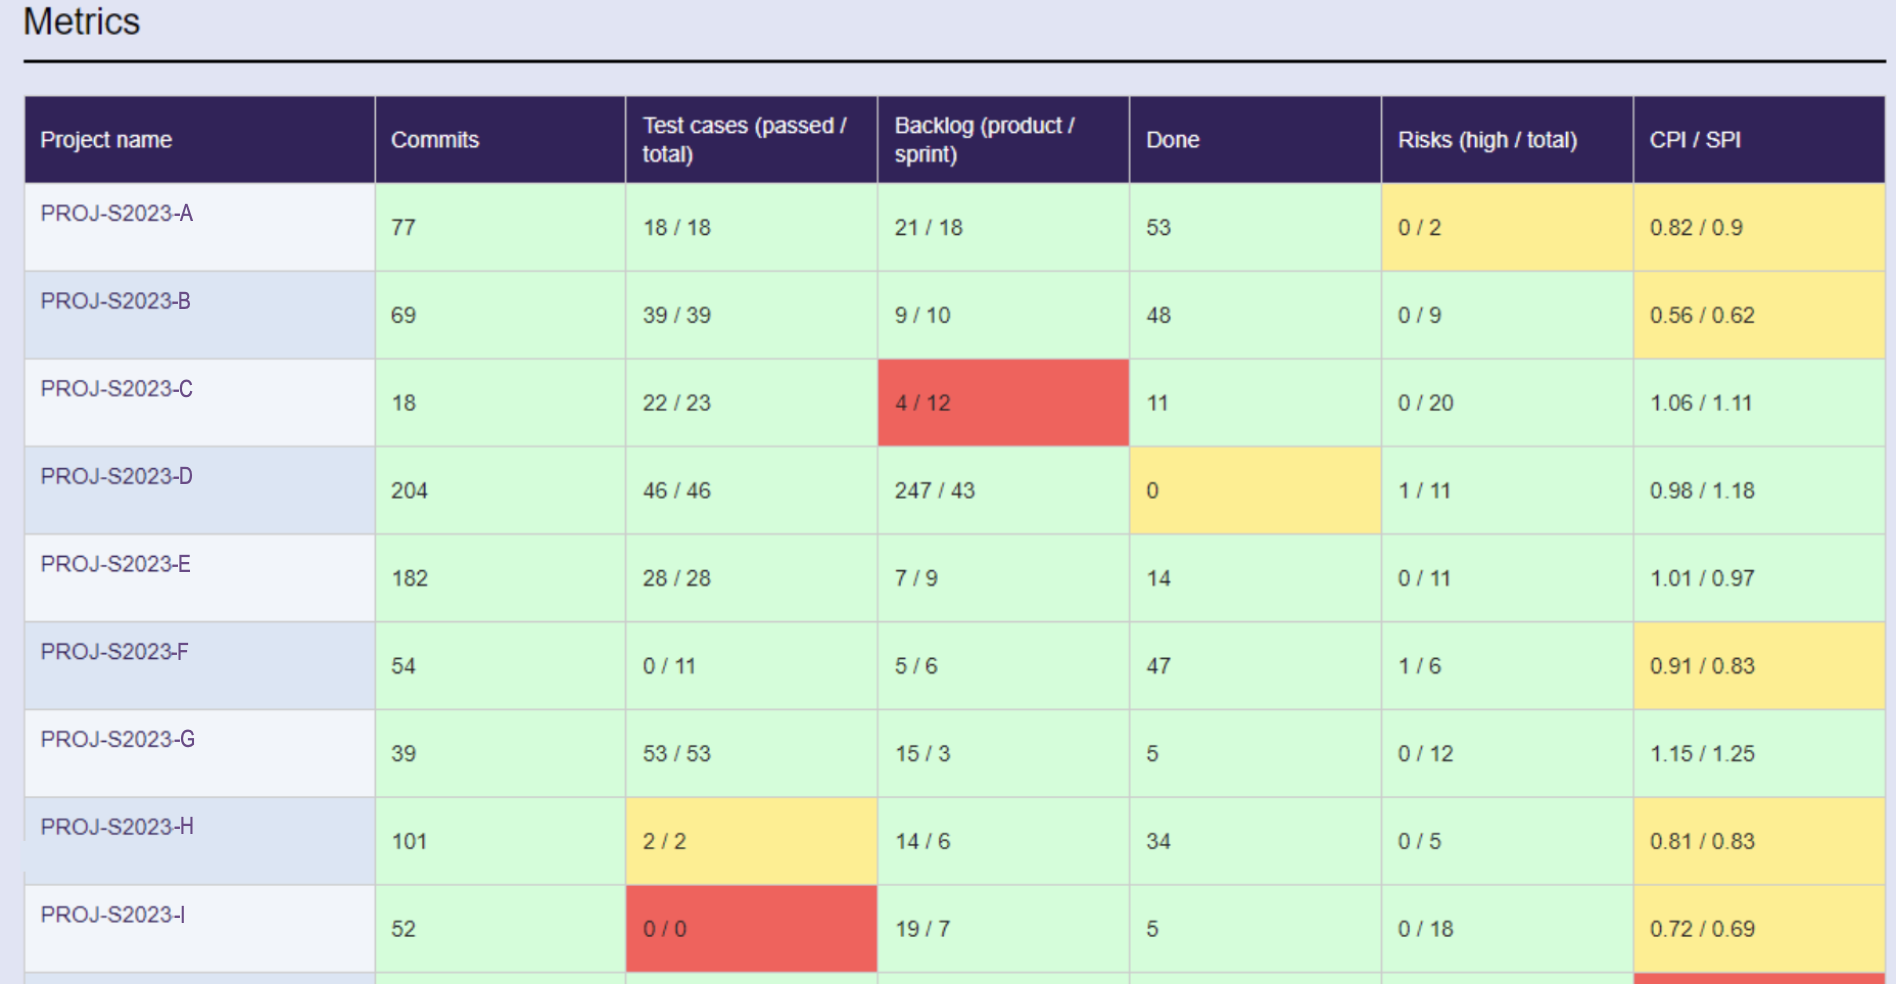
If you want to see the projects' state according to different metrics, you can also see them as values and as traffic lights. The colours of the traffic lights depends on the value of the metrics and also on the other metrics and the current phase of the projects.
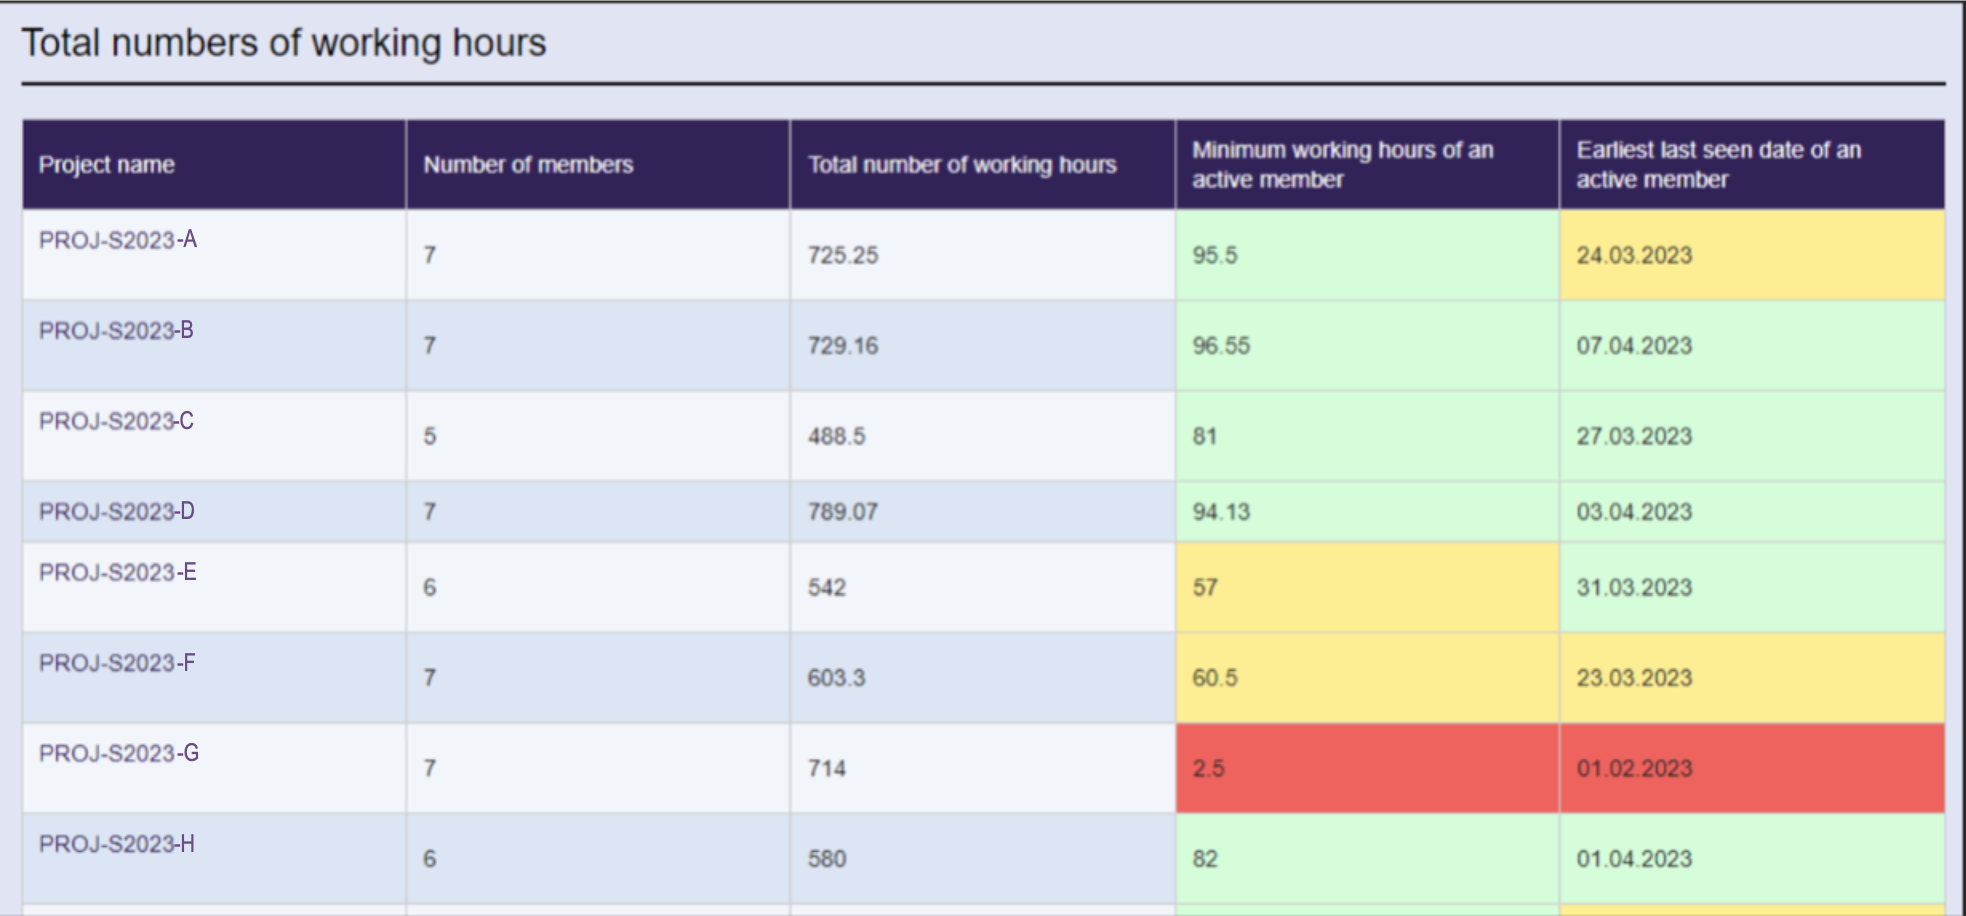
At the end of the Statistic Page, you can see the Working Hours of each project.
The traffic lights warns if it seems that someone has done significantly less hours than the others on the group or the project member has not been participated to the project work for a while.
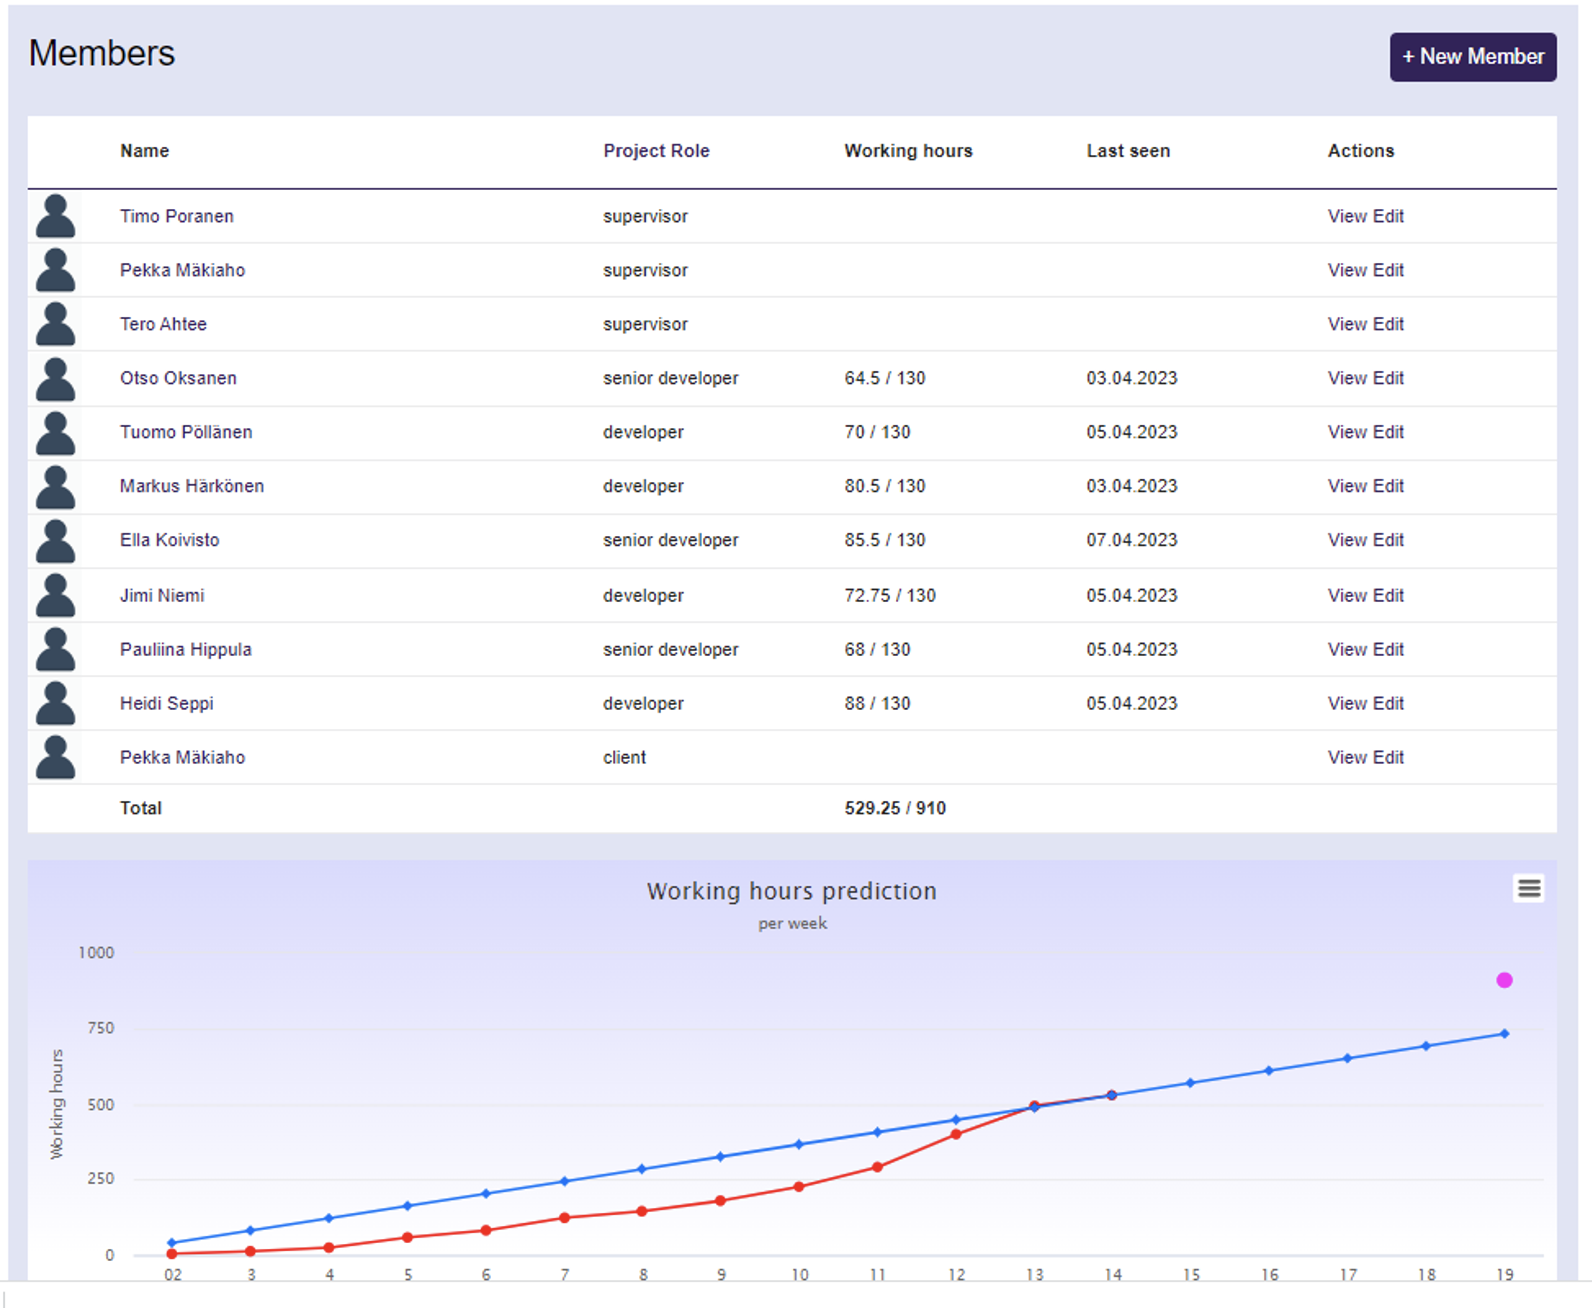
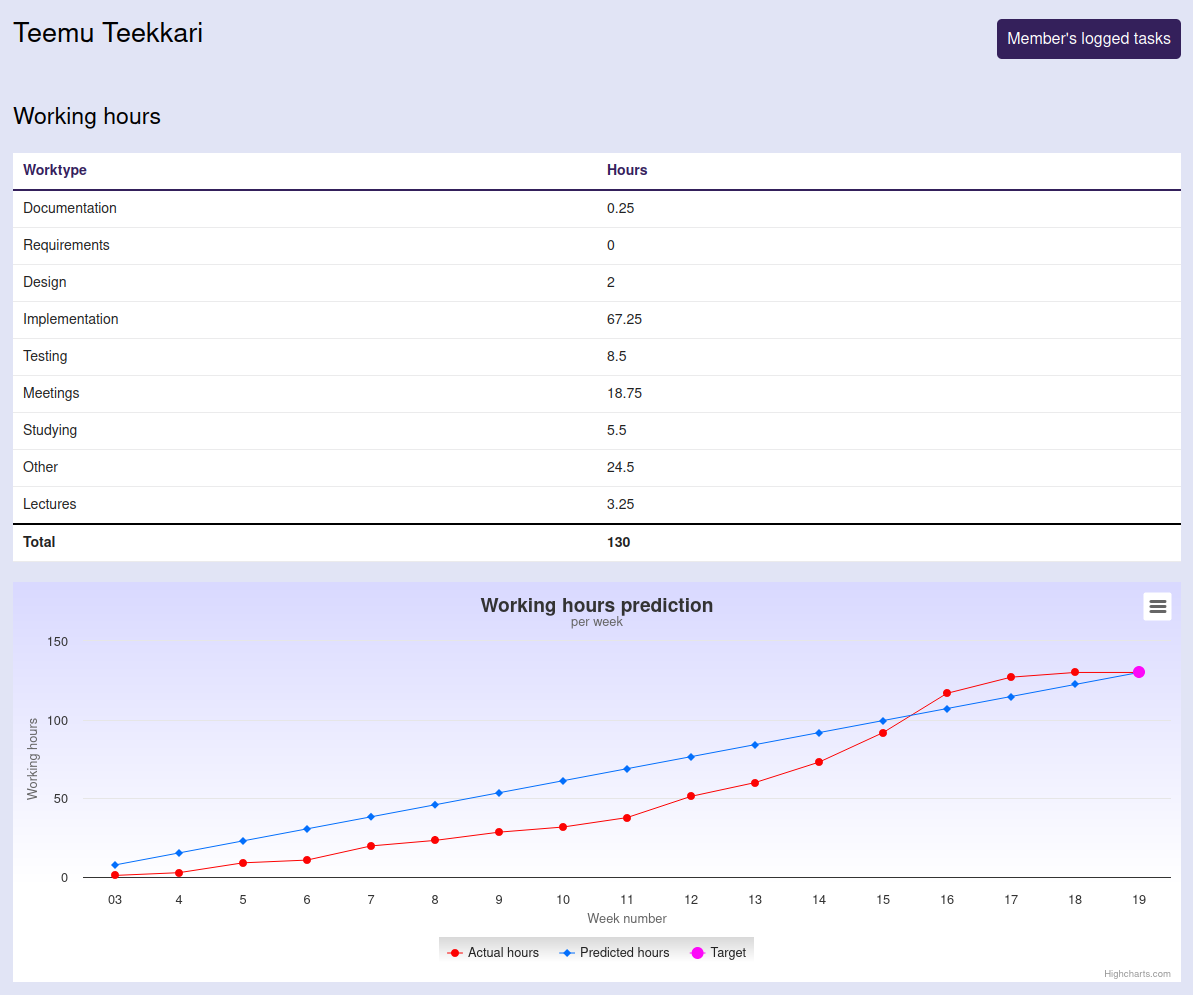
You can also select a project and see the working hours of each member at more detailed level and see the prediction of the working hours at the MEMBERS PAGE.
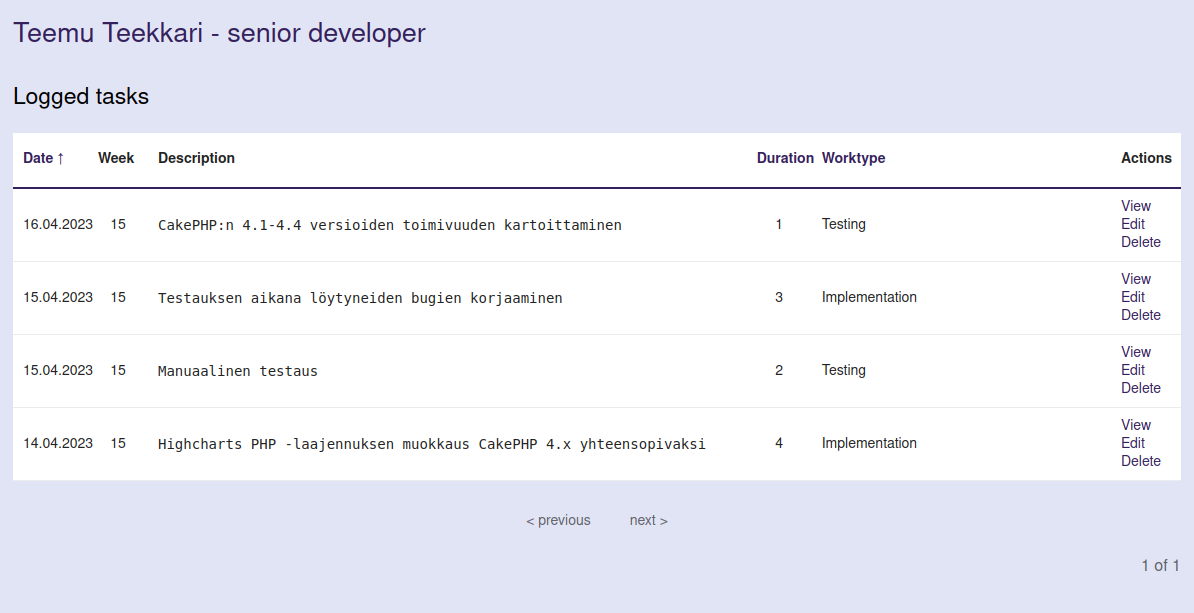
If you want to go to personal level: you can select a member of the group and see his or her logged hours by selecting a member above.
And you can even see what kind of project work the member has logged at the LOG TIME PAGE.
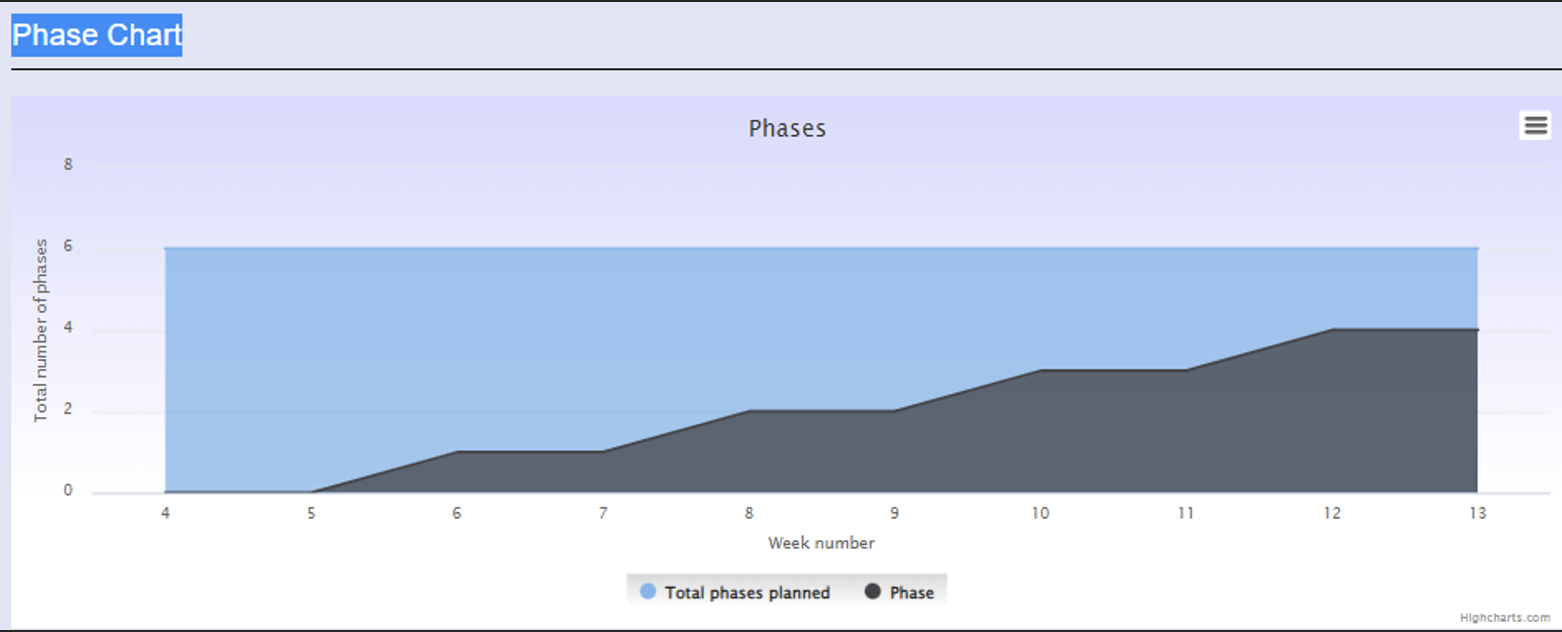
If you want to go inside the project, you can select a project and go to CHARTS PAGE.
PHASE CHART gives you information how the project is divided to the phases (e.g. sprints, iterations, etc.) and what is the current phase.
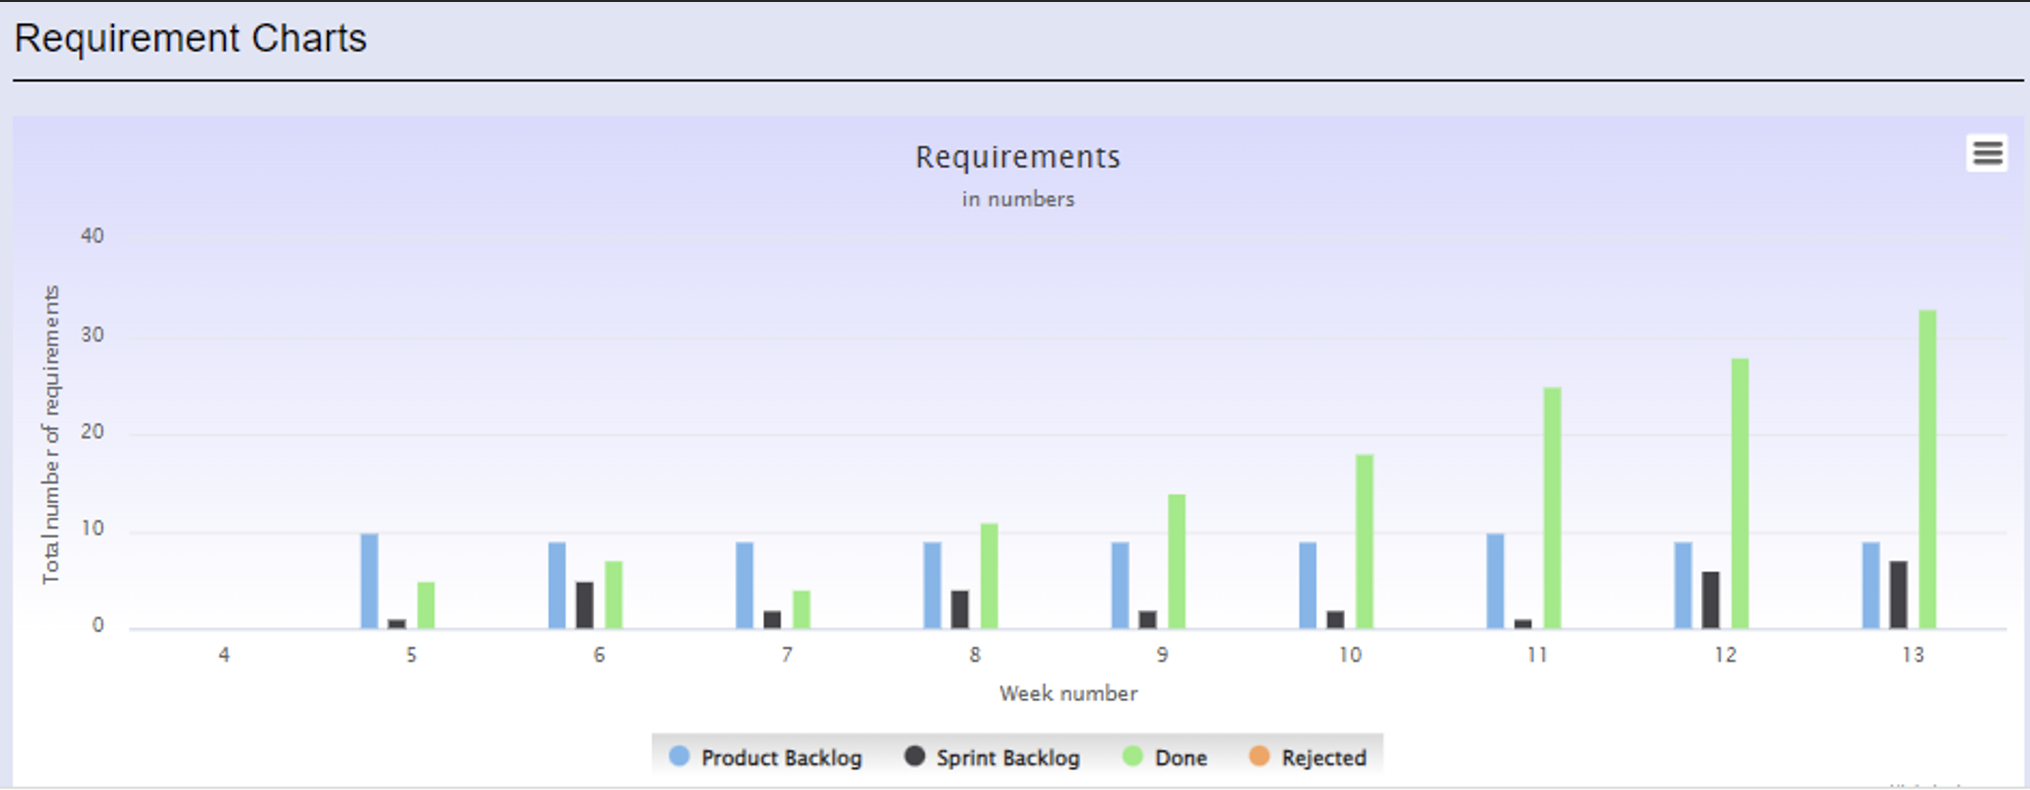
Requirement chart gives information weekly based, how many requirements there are still in the product backlog, how many in the backlog of the current sprint. How many requirements have been already done and if some have been rejected.
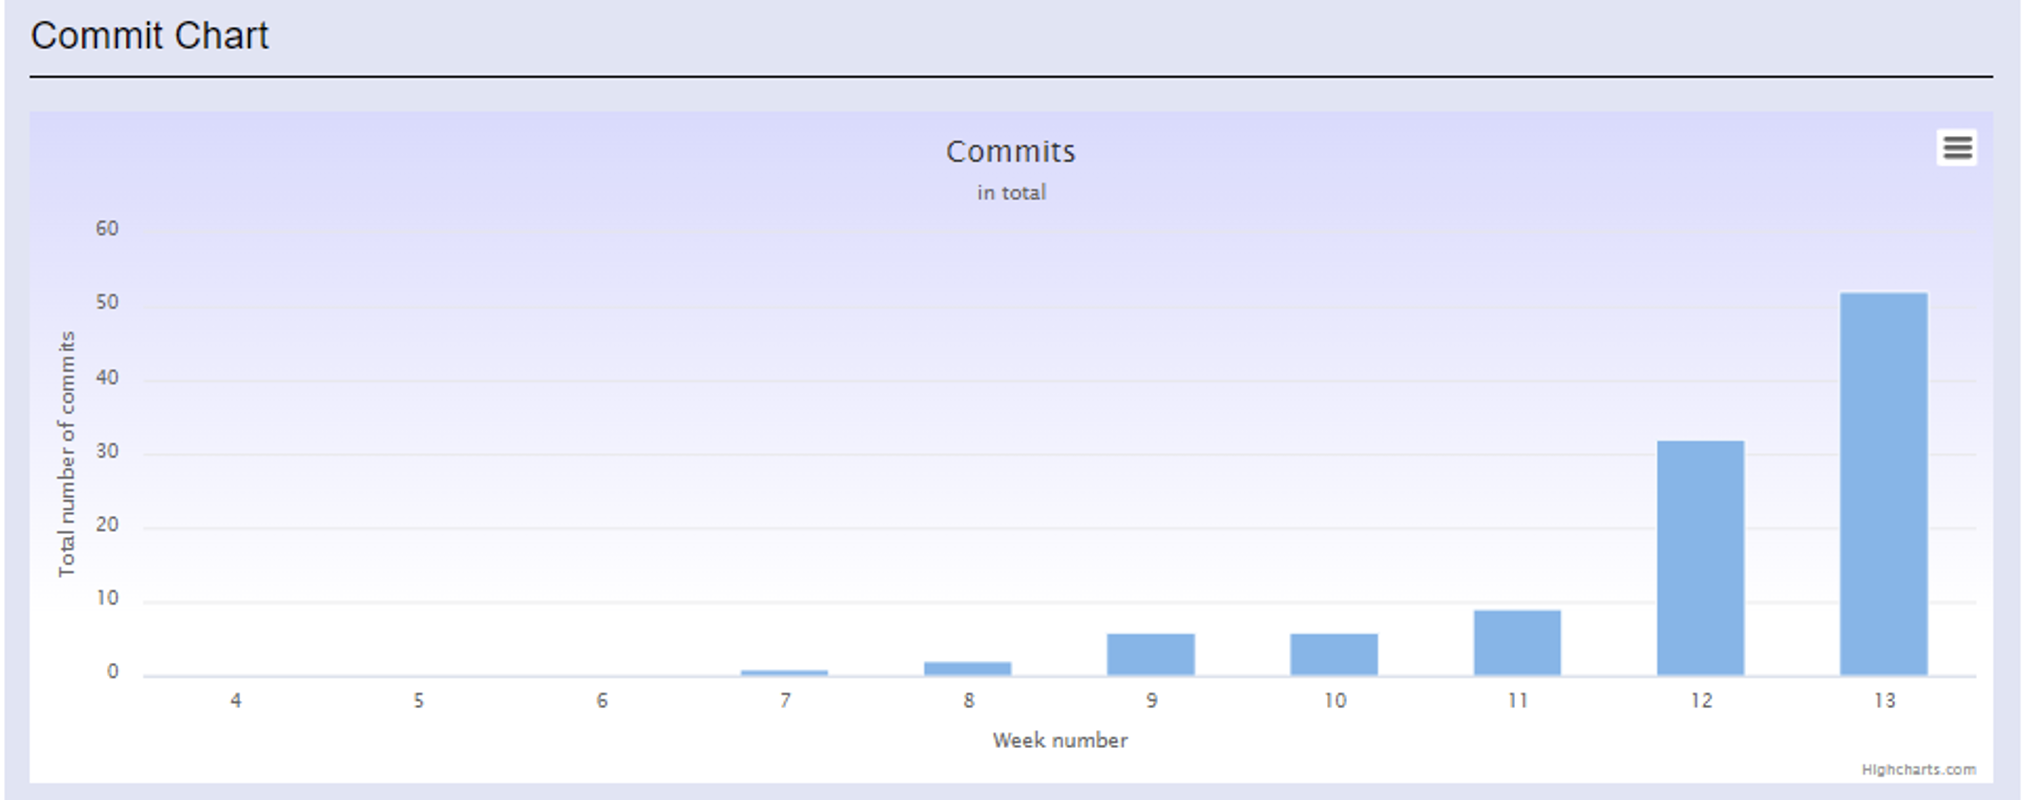
Commit chart shows the proceeding of software projects: what is the total amount of commits made to the version control system:
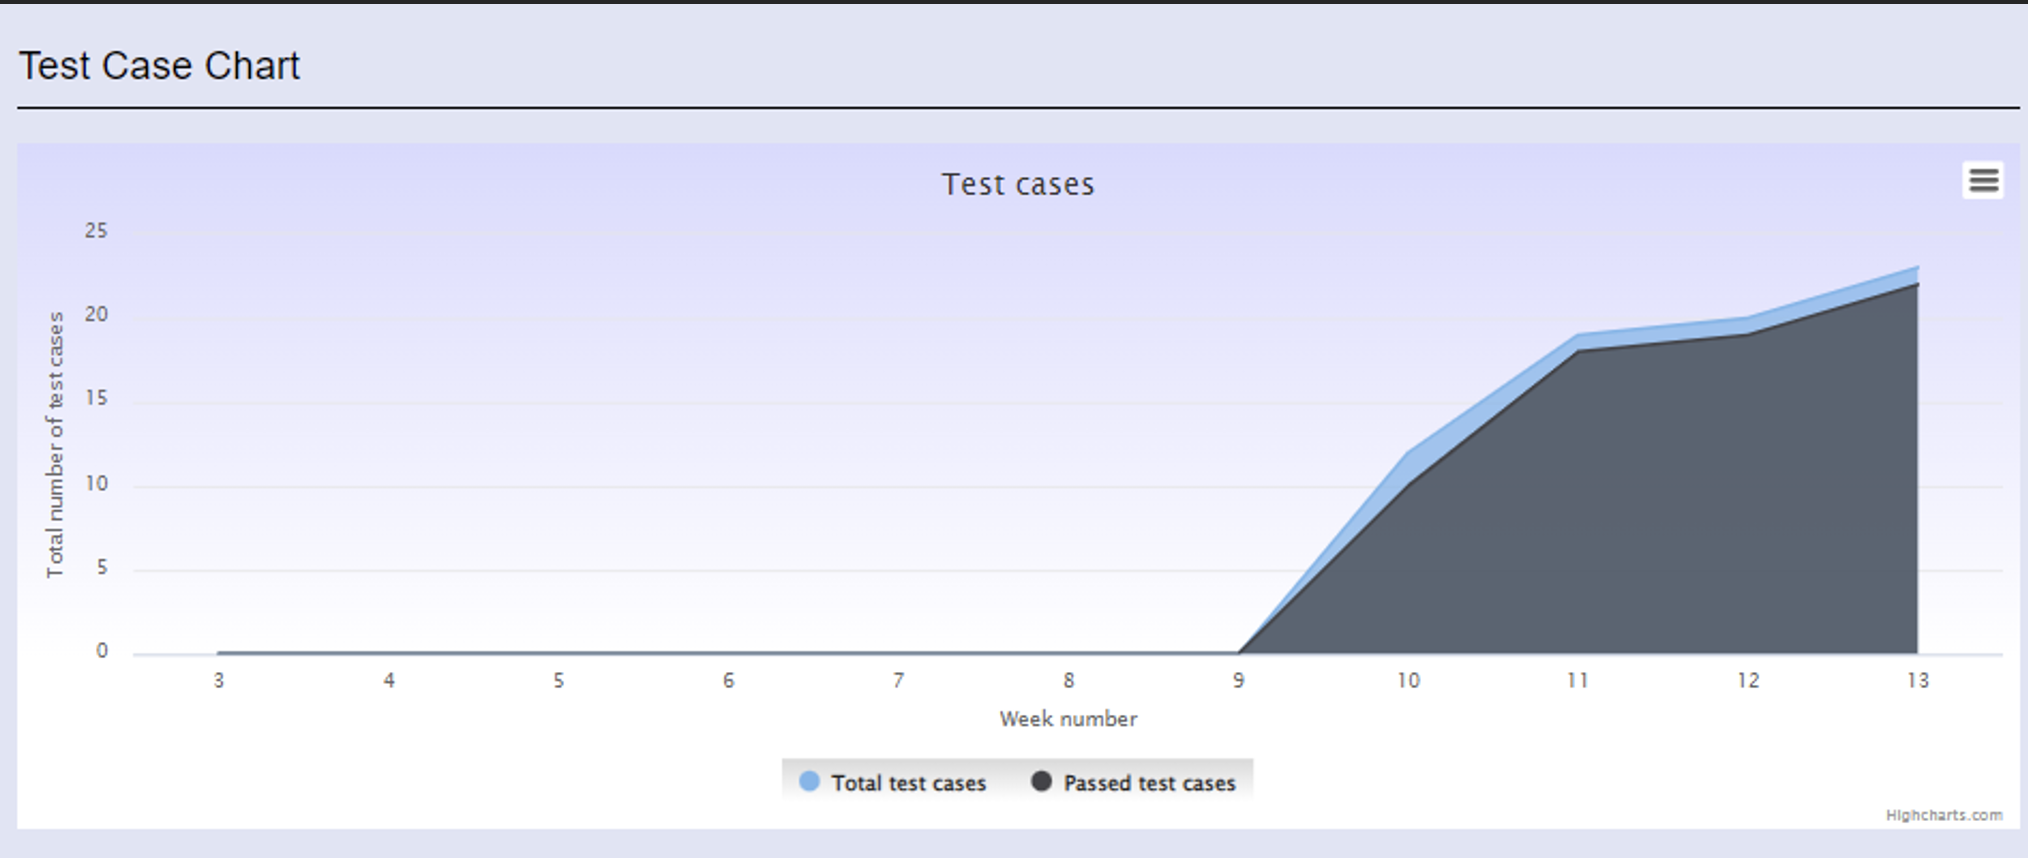
Test case chart shows how many test cases there are and how many of those have been passed.
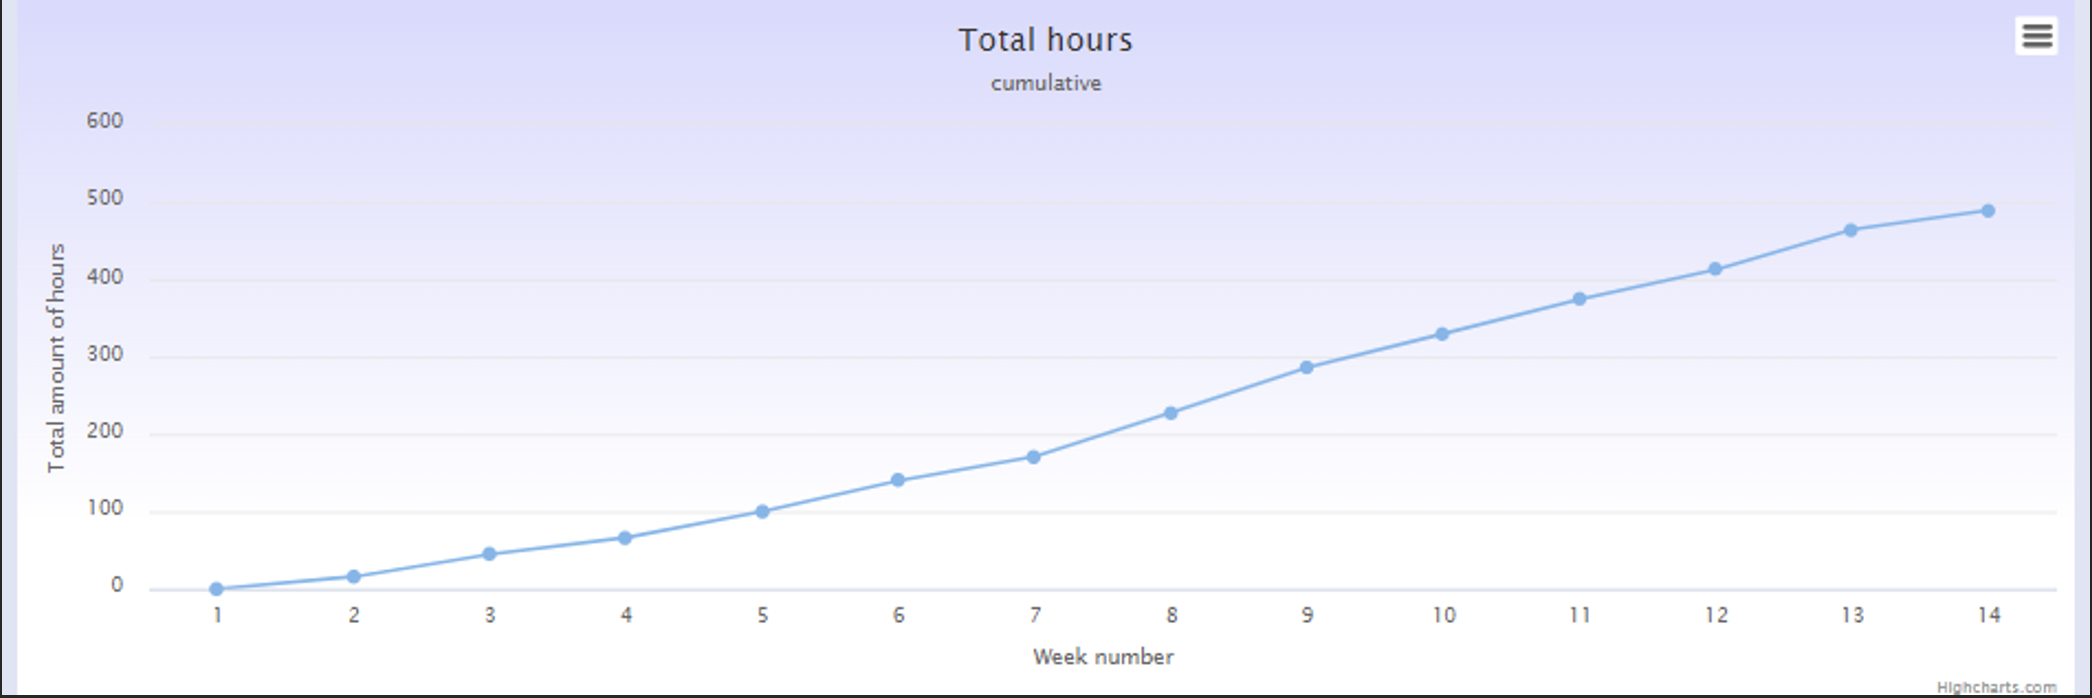
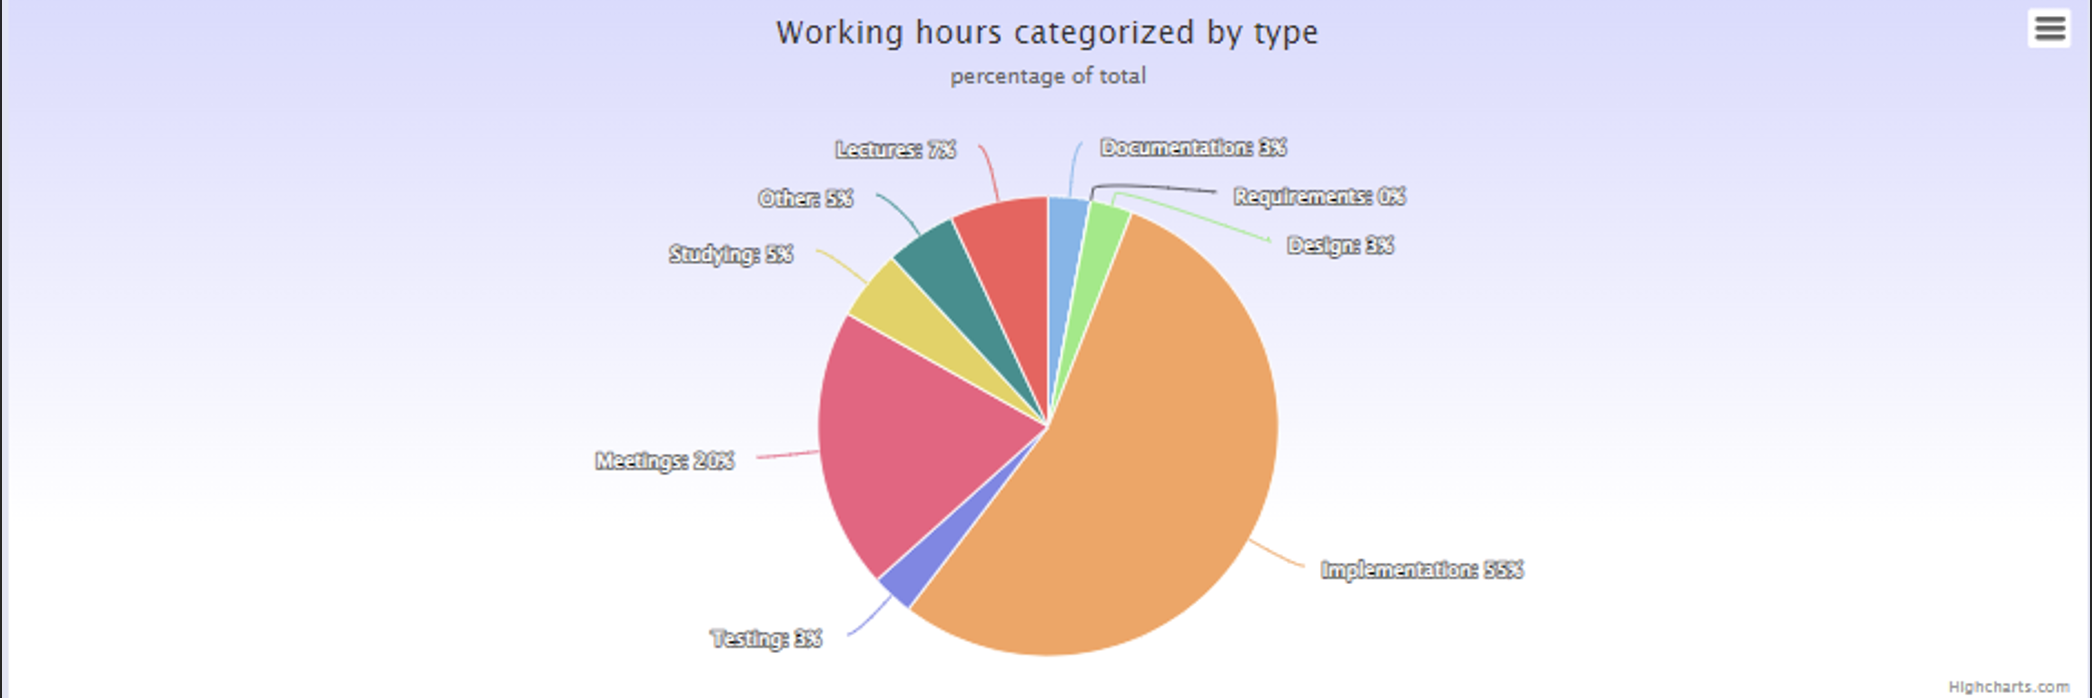
Working hours charts show the done work categorized and also how the total amount of working hours increases weekly.
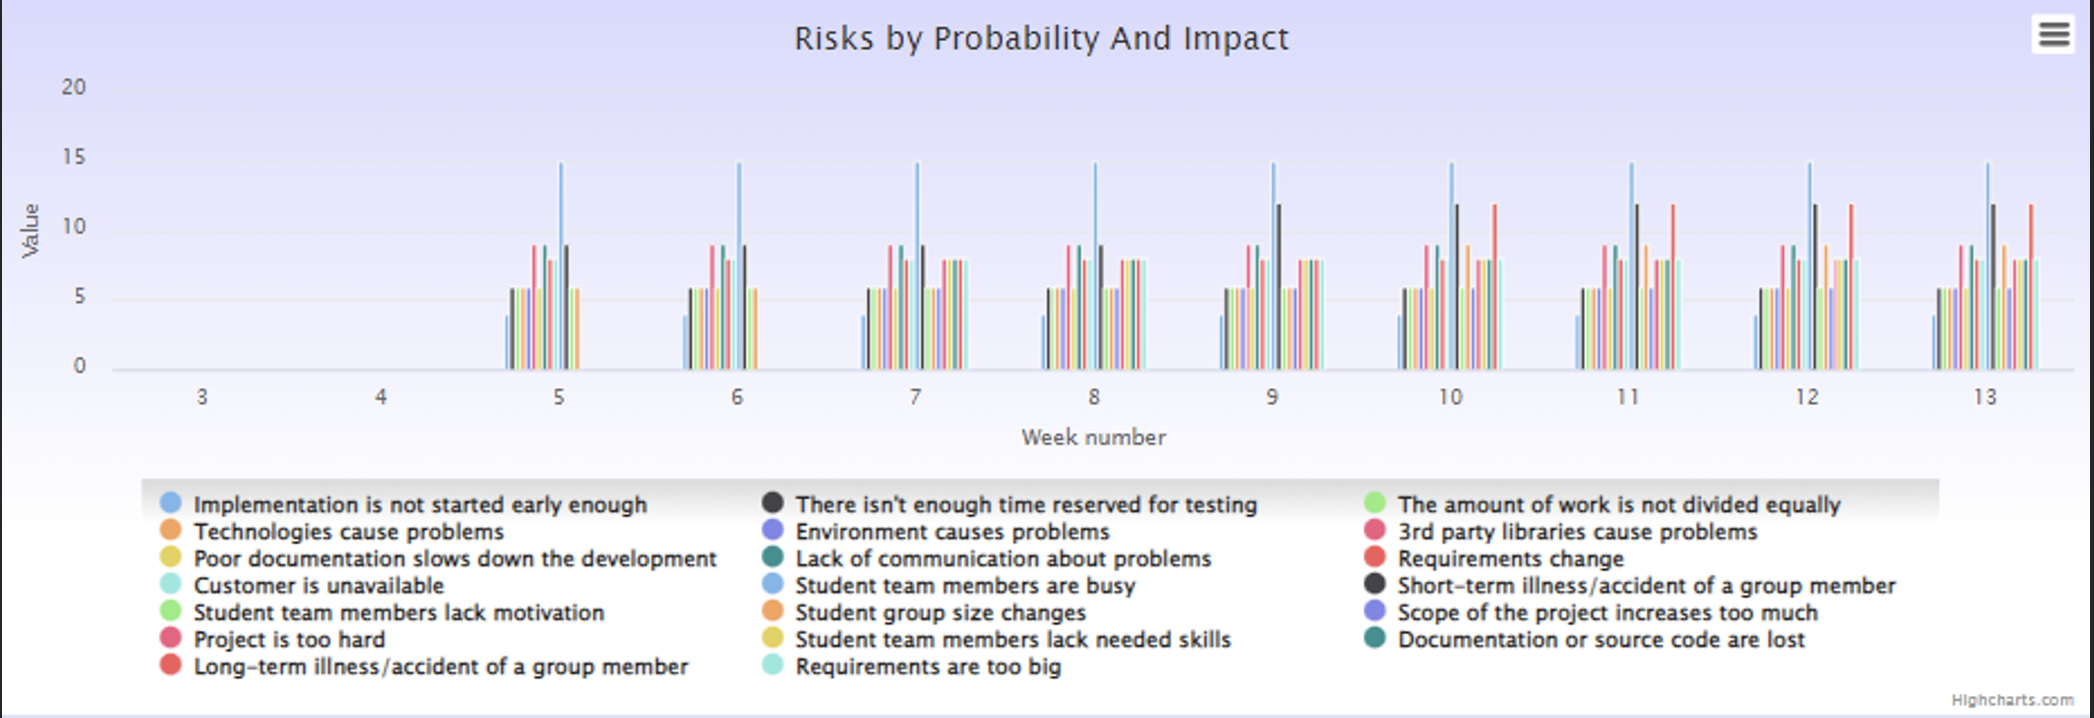
There are also several charts on risk, based on probability and impact, for example.
The one below shows a combination (multiplication) of the probability and the impact of the risks.
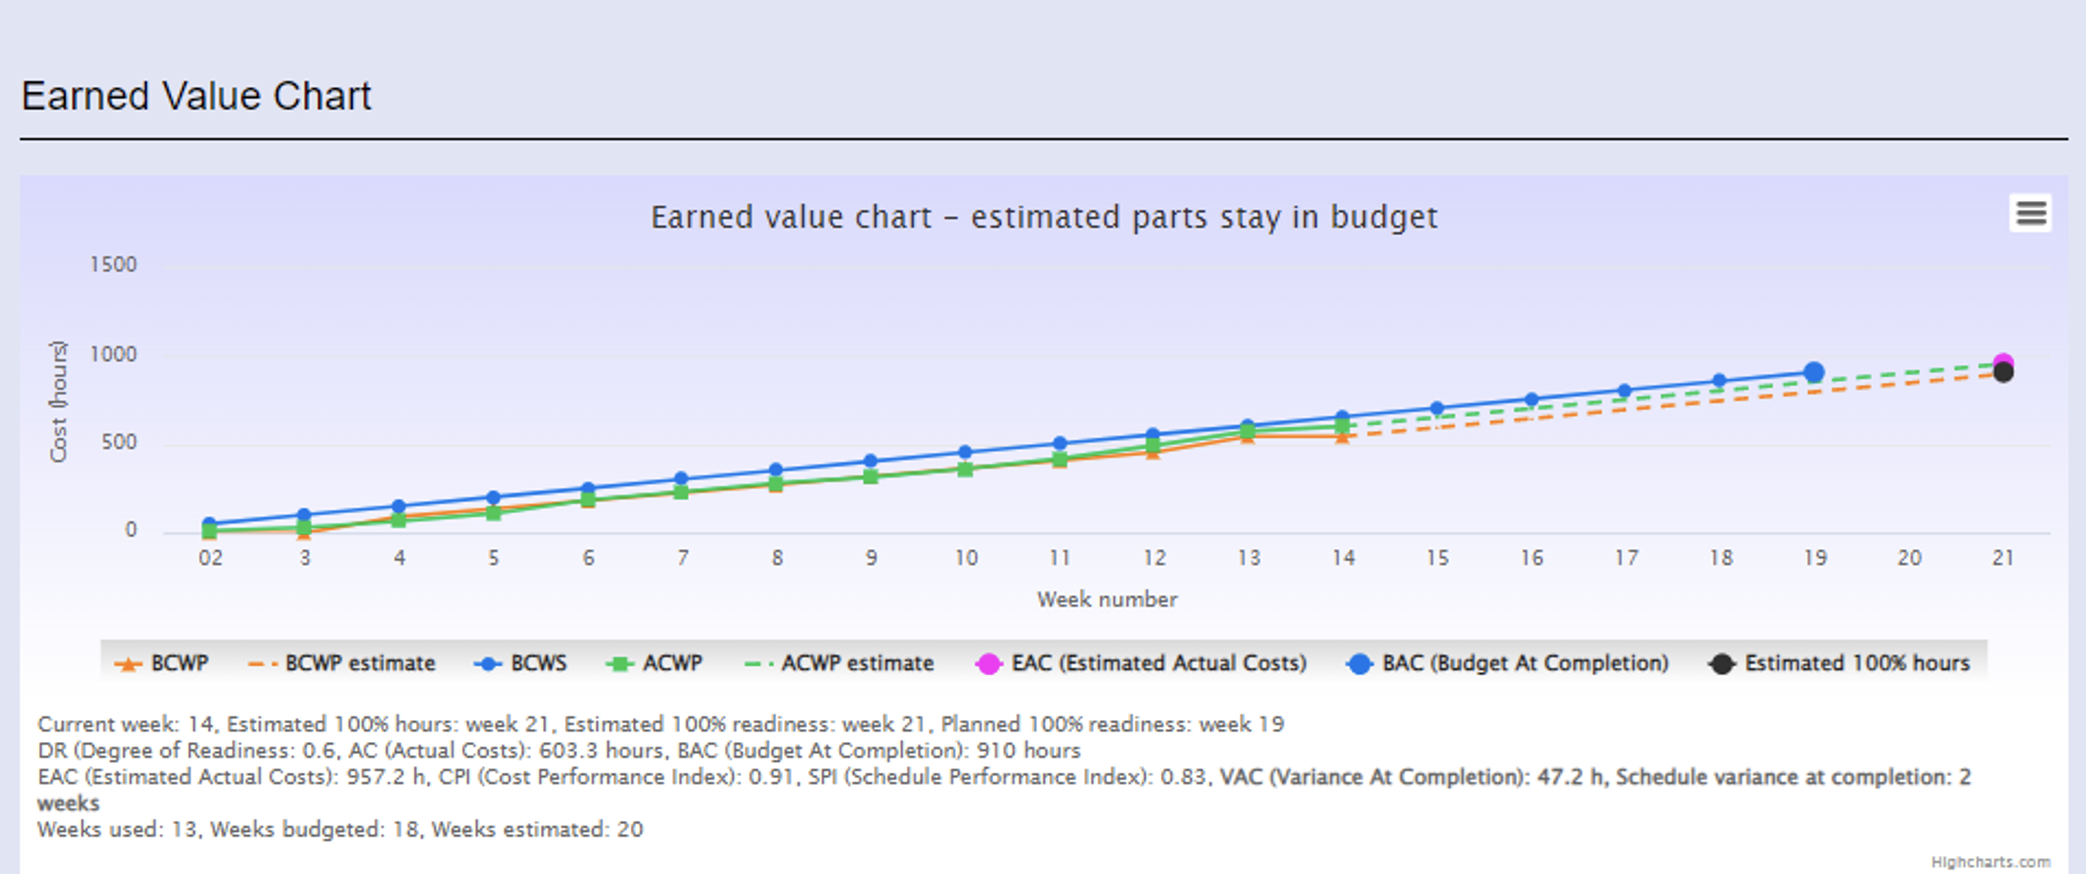
There are also charts you can use to predict the project on the base of the earned value.
Here you can see that the project was planned to be finished by week 19 and there were budgeted 910 hours.
However, there has been delays and even if the project continues as originally planned, the project will be ready at week 21 and will use 957 hours.
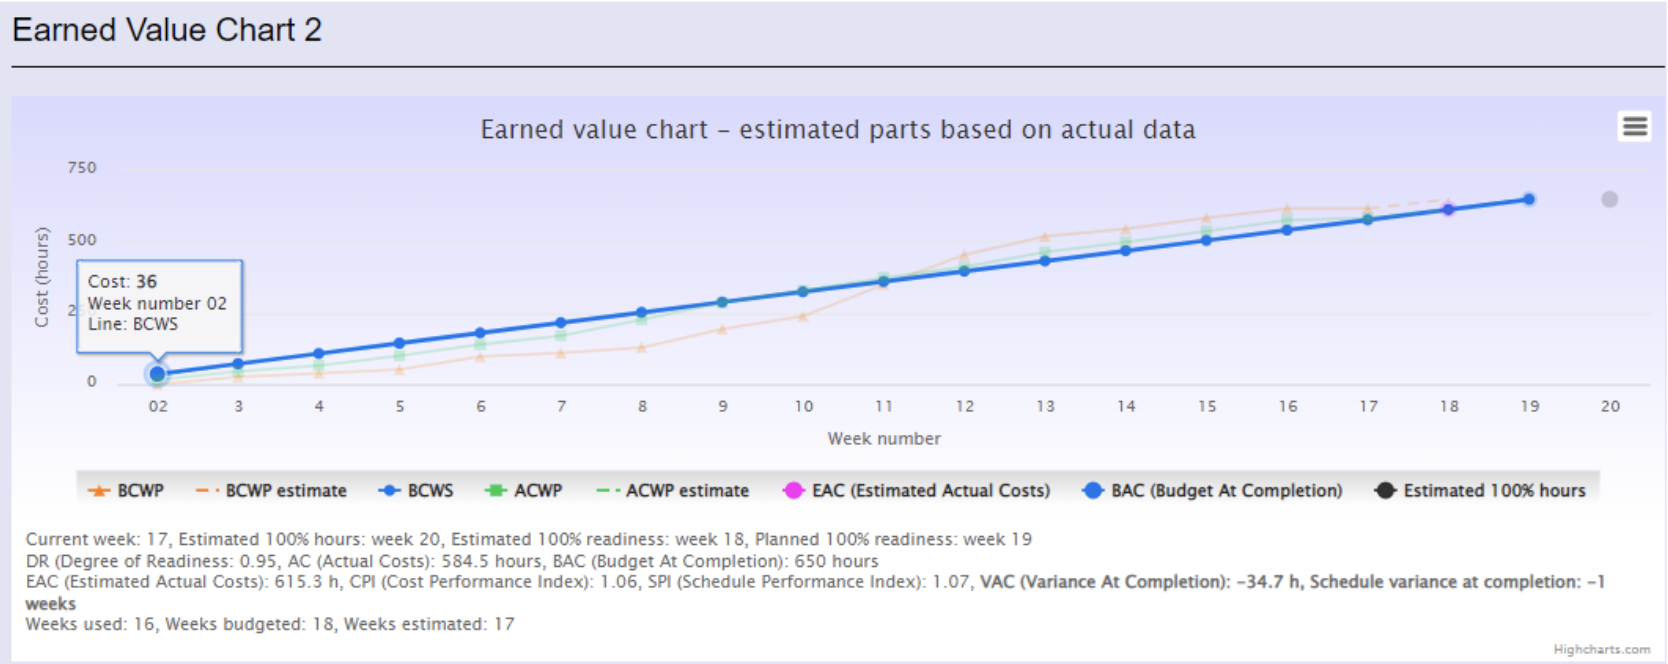
Below, in another project, we are predicting the project assuming that the project's deviation (regarding the budget and the schedule) remains the same as it has been so far.
Test environment
You can view all the public projects at the production site with next account:
username: guest@guest.com / password: guestguest
You can also visit the test environment.
On the test environment, you can use the next user accounts:
username: test@test.com / password: testtest
username: manager@m.com / password: managermanager
username: customer@customer.com / password: customercustomer
If you want more information and/or create your own projects, just send e-mail to pekka.makiaho@tuni.fi or use
LinkedIn.
See also publications related to MMT.
Release notes
Version 8.0 (26.4.2023)
- Made a Dockerfile for using Docker as the development environment
- Updated CakePHP version from 3.x to 4.x
- Changed charts from HighCharts PHP plugin to HighCharts JS library
- Removed project’s publicity feature
- Bug fixes
- Accessibility fixes
- Changed Supervisor role to Coach and Client to Customer
- Updated several pages and added a privacy notice
- Increased logout timeout
- Updated GitLab WIKI
Version 7.0 (12.5.2021)
- Security analysis & updates accordingly (GDPR compliance, threat modeling, manual reviewing, penetration testing)
- Server transfer with both production site and test environment
- PHP 7.4 update
- Database updates - f.ex. removing default NULL-values, removing phone number
- Documentation - full database diagram, creating GitLab WIKI
- Changing former member role of a manager to senior developer (both in code and database)
- Weekly report: Only senior developer can modify working hours after the weekly report is done
- Last seen -timestamp to user's personal data / members page
- Tooltip for the degree of readiness
- Bug fixes & overall testing
Version 6.2 (24.8.2020)
- New work types and metric types added (including project's degree of readiness and overall status metrics)
- Earned value method method implemented (data and charts visible only to supervisors)
- Pie chart added displaying projects working hours categorized by type
- New metrics table and some new data added to statistics page (only visible to supervisors)
- Usability updates and bug fixes: new tutorial videos, better instructions for forms, small layout updates
Version 6.1 (4.4.2020)
- GitHub connection that can fetch number of commits for weekly report
- Predictive chart for project's total hours
- Information of the weekly report creator and updater displayed in weekly report
- Usability updates: target hour marker for the member's personal working hours chart, display metric name when updating, better error messages for weekly report forms, group project's connection settings into project's info page
Version 6.0 (16.3.2020)
- Increase of the mobile usability
- Last activity of a project member shown
- Personal working hours chart and prediction of the total hours during the project
- Bugs fixed: HTTPS-redirection issues, diagram visibility issues for supervisors, working hours diagrams issues
- Coming soon: linking to version control systems, usability improvements, prediction for the project…
Previous versions
Version 8.0 was implemented in Spring 2023 COMP.SE 610/620 by project group Artesaaniratkaisu.
Project manager: Otso Oksanen. Developers: Ella Koivisto, Heidi Seppi, Jimi Niemi, Markus Härkönen, Pauliina Hippula, Tuomo Pöllänen.
Version 7.0 was implemented in Spring 2021 TIEA4 & TIETS19 by project group MMT-VII.
Project manager: Juha Ranta-Ojala. Developers: Katrin Dieter, Auli Jukkola, Tittamari Salonen, Tatu Sikkinen.
Versions 6.0-6.2 were implemented by Mikko Luukko as a TIETS16 programming project during the spring term of 2020.
Version 5.0 were implemented during the fall term of 2019 as a coursework for TIEA4 Project Work course and TIETS19 Software Project Management course. The team consisted of two project managers (Hanna-Riikka Rantamaa and Henna Lehto) and four developers (Kimi af Forselles, Mikko Luukko, Tommi Piili and Ville Niemi). Updates included: new interface with TUNI-Theme (logo and brand of the new Tampere University), new diagrams like comparing the total hours of the project to the all parallel public projects, HTTPS protocol, bug fixing and other smaller features.
Version 4.0 was implemented by Murat Pojon as a TIETS16 programming project during the spring term of 2017.
Versions 2.0-2.1 and version 3.0 were implemented by Sirkku Seitamäki as a TIETS16 programming project during the summer and fall terms of 2016.
Versions 1.1-1.3 were implemented during the spring term of 2016 as a coursework for TIEA4 Project Work course and TIETS19 Software Project Management course. The team consisted of two project managers (Elena Solovieva and Choudhary Shahzad Shabbir) and two developers (Andreas Valjakka and Sirkku Seitamäki).
Version 1.0 was the product of the fall 2015 Project Work team. Jukka Ala-Fossi and Mykola Andrushchenko were the developers in the project and Katriina Löytty was the manager. This was the first version taken to production.
Version 0.9 was developed during the academic year 2014-2015. However, after the testing and evaluation, it was never taken to use. Even if the coding of the next version was started "from the scratch", a lot of ideas were gathered and implemented during the project.